Today I’m sharing how to use Google Analytics to grow your food blog! You’ll learn five important metrics to focus on, how to get to them in the GA dashboard, and how you can use that information right now to help you grow!
If you’re just starting a blog, you’ve likely heard that installing Google Analytics is one of the first things you should do in order to measure your progress. It tracks everything from page views to readers’ behavior on your blog and is an extremely useful tool.
(If you haven’t installed Google Analytics yet, do that here and then come back)
At first glance, the Google Analytics dashboard (that’s your home screen) can be really overwhelming. The good news is, you don’t have to take it all in at once.
You can pull up your GA dashboard in a second tab and follow along as you read through this! These are the metrics I check daily and use to guide business decisions while growing my food blog.
Navigating Your Dashboard
First, a quick run-down of the Google Analytics dashboard (see the photo below).The menu on the left is going to be what you use to navigate through different reports (Real-time, Audience, Acquisition, etc.)
For each of these five metrics, below the photo you’ll see “how to find it” in bold, which will break down the path you follow to get to the report.
1. Tracking How Your Readers Are Getting To Your Blog
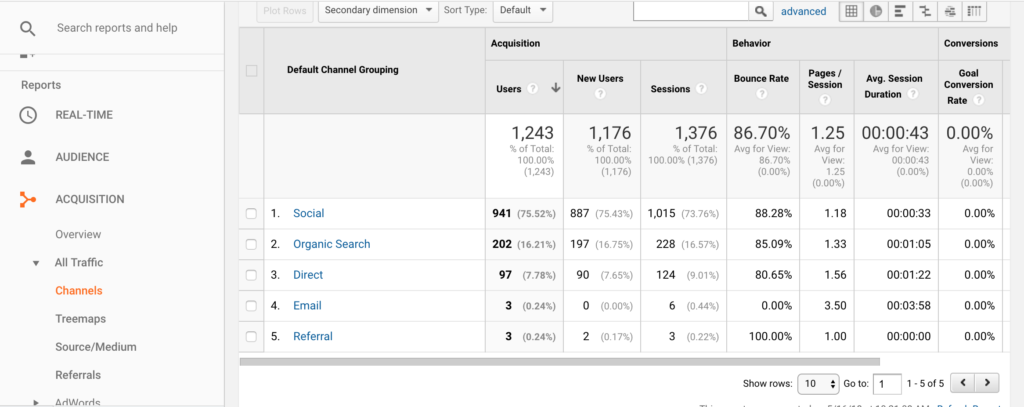
How to find it: Reports/Acquisition/All Traffic/Channels
What it tells you: Looking at your “Channels” report gives you a breakdown of where your readers are coming from to get to your site. It’s usually broken down into things like:
- Social (Facebook, Pinterest, Instagram, StumbleUpon, Twitter, etc.)
- Organic Search (coming from a search engine, like Google)
- Direct (they came straight to your website by typing in the URL)
- Email (if you have an active email list)
- Referral (clicked on a link to your blog from another blog or website)
By looking over where your audience is coming from, you can get a good idea of where you should focus your efforts and where your target audience typically “hangs out”. Most food bloggers have a large amount of traffic from social media, so that would tell you to invest time and resources into building your presence there.
2. Social Media Traffic
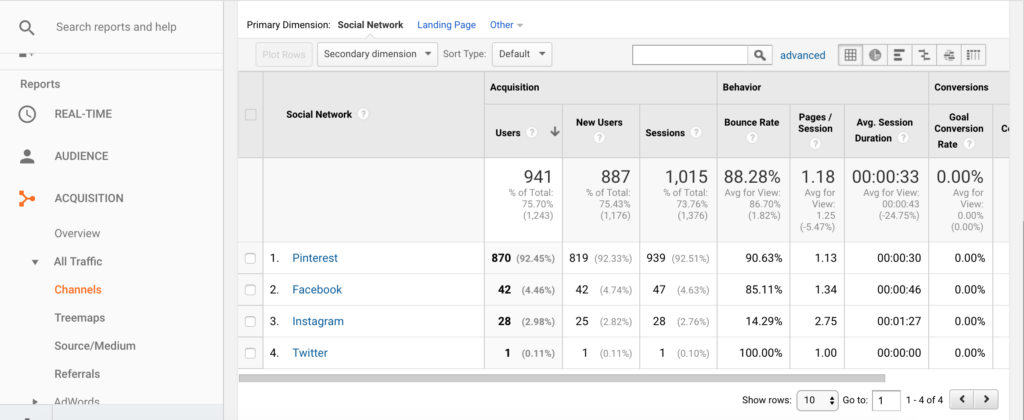
How to find it: Reports/Acquisition/Channels/Social
What it tells you: This report takes the report from Step 1 another step further. As a food blogger, you’re constantly told that you should be putting your content EVERYWHERE. Pinterest, Facebook, Instagram, StumbleUpon, Twitter…you get the idea.
One of the most important lessons I learned early on was that you can try to do everything and just do an ok job, or you can pick one or two things to do and do them awesomely. This is a great strategy for social media.
By looking at your social media traffic report, you can see which platforms are worth your time. My advice: pick one source to work on for a month, see how it goes, and make adjustments the following month (or switch to a different platform to focus on!)
Personally, I spend a lot of time on my blog’s Instagram, but when I look at the numbers I can see that it really doesn’t drive much traffic to my blog. That would tell me that a better use of my time would be to invest that elsewhere!
3. Site Content- Where Are Your Readers Going?
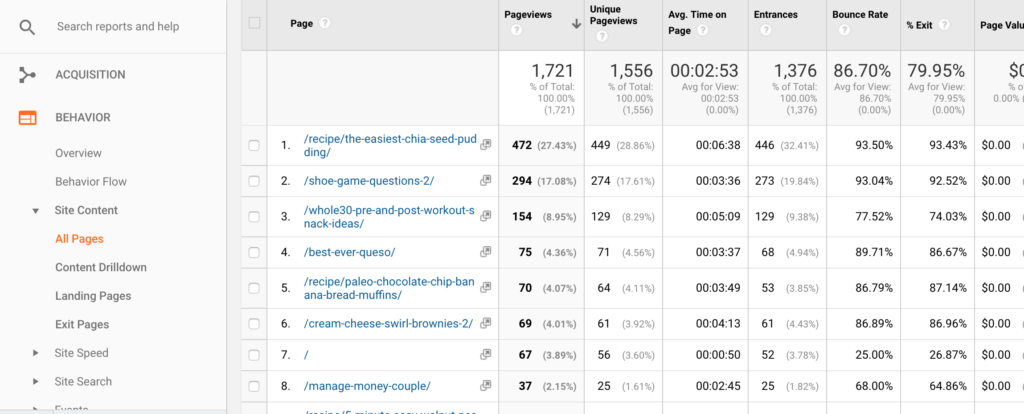
How to find it: Reports/Behavior/Site Content/All Pages
What it tells you: Your Site Content Report is perhaps the most useful tool in all of Google Analytics for growing your food blog. This report tells you which pages on your food blog take in the most traffic.
How can you use that information? By knowing what pages are most popular, you can do things like:
- Create similar content since it seems to resonate with your readers
- Place e-mail opt in forms to grow your email list
- Integrate affiliate links to capitalize on that traffic and earn money
- Provide content upgrades in order to keep your readers happy
4. Referral Path To Your Most Popular Pages
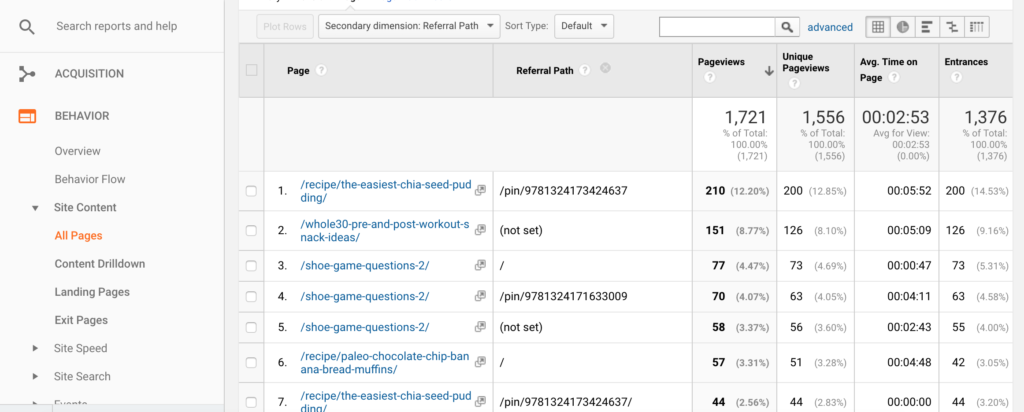
How to find it: Reports/Behavior/Site Content/All Pages with a secondary dimension of “Referral Path”
(To add a secondary dimension, see the drop down box at the top of the photo above, around the middle. You’ll see it displays “Secondary dimension: Referral Path”)
What it tells you: Now you’re getting down to the nitty gritty. This report focuses on your most popular posts and looks at how your reader got there. If most of your traffic is from Pinterest, this report will show you exactly which pin was clicked on in order to bring that reader to your site.
Is it just a photo of your final product? A long pin with both images and text? A text-only pin?
Use this information to craft future pins and drive more traffic to your site.
5. Reader Behavior Flow
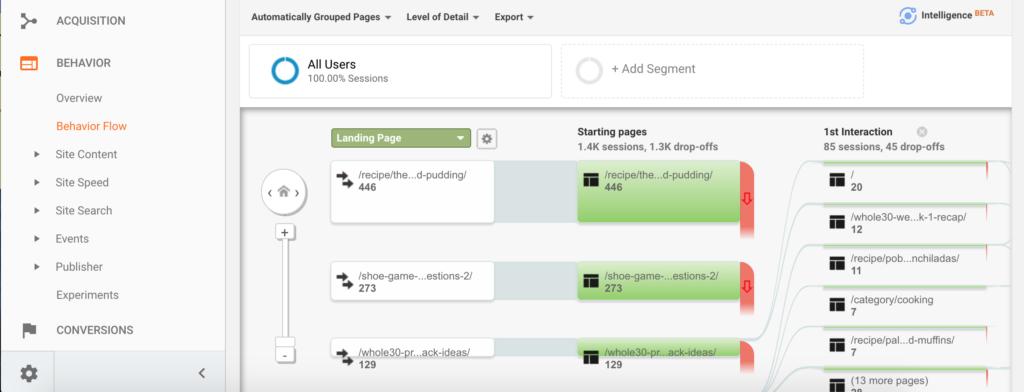
How to find it: Reports/Behavior/Behavior Flow
What it tells you: This is a report you may not look at daily, but it’s interesting to check out once a month or so. This flow chart shows you the path a reader takes once they arrive at your site.
Are they just visiting one page and then dropping off?
Are they continuing on to other recipes?
Early on, I noticed that so many of my readers would visit one recipe and then leave. This prompted me to investigate ways to make my content more accessible so that a reader could navigate through more of my site. This increases the chances of them becoming an email subscriber, clicking on an affiliate link, etc.
You have lots of great content-make it easy to navigate so your reader sticks around!
Want more info? Here are some other helpful food blogging articles:
- How to Take Your Food Photography To The Next Level Without Spending $$$
- Best Tools For Beginner Food Bloggers (Plug-ins, Tailwind vs. Board Booster, and more!)
I hope these tips have been helpful for learning how to use Google Analytics to grow your food blog! Let’s continue the discussion- comment below with something new you learned from this tutorial and how you will apply it to your blog!


Hi jessica,
Im a food blogger myself, and this post provided much valuable insights regarding various reports. Thanks a TONN!!!